
Hello and happy new year. January 2018, can you believe that? Well, with 2017 firmly in the rearview mirror I can say that it was probably the best year I lived through (so far).

The market was on fire, I bought a 2nd house, started 3 companies and blew past my dividend goals.
Let’s check out January’s progress.

Dividend Income
For the month of January I received dividends from 13 different companies.
| Ticker | Company Name | January |
| TSE:AQN | Algonquin | $226.50 |
| TSE:ZLB | BMO LOW VOL ETF | $166.00 |
| TSE:ENF | Enbridge | $111.56 |
| TSE:NVU.UN | Northview Apartment REIT | $107.96 |
| TSE:AX.UN | Artis REIT | $107.55 |
| WPC | W.P. Carey | $101.00 |
| TSE:PLZ.UN | Plaza REIT | $92.79 |
| TSE:ALA | AtlaGas | $76.47 |
| TSE:SJR.B | Shaw | $31.60 |
| TSE:AD | Alaris | $28.22 |
| O | Realty Income | $21.25 |
| TSE:PZA | Pizza Pizza | $18.47 |
| TSE:CPG | Cresent | $15.00 |
| TOTAL | $1,104.37 |
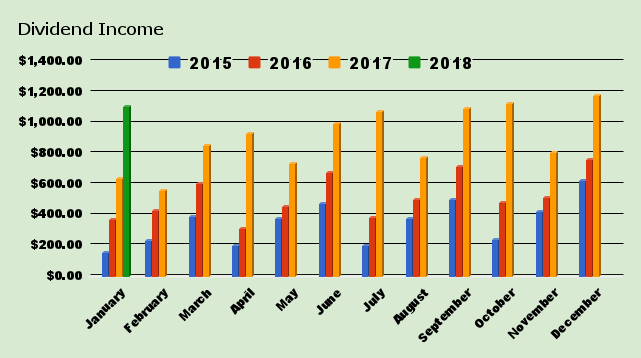
- I received $1104 in dividends for the month of January
Obviously this is the best start to the year I ever had but passing $1100 so quickly is quite satisfying. All the hard work is really starting to pay dividends 🙂
Dividend Increase and highlights
-
Realty Income Announces Dividend Increase Of 4%
I own 24 companies at the start of 2018.
1 of 24 companies I own have increased their dividend payout this year.
0 Dividend cuts in 2017.
I have not had a dividend cut so far this year.
Nuts and Bolts
January 2018
- My year over year increase for January was 72.80% or $465.25 more than January 2017.
- My quarter over quarter increase was down -1.81% or $20.34 less than 3 months ago due to selling Western Digital at a profit of 127% not including dividends.
| Month | 2015 | 2016 | 2017 | 2018 (Tot) | 2018 ($) | 2018 (%) |
| January | $152.00 | $367.00 | $639.12 | $1,104.37 | $465.25 | 72.80% |
| February | $229.00 | $427.00 | $557.24 | |||
| March | $385.00 | $602.00 | $850.50 | |||
| April | $201.00 | $313.00 | $931.94 | |||
| May | $375.00 | $456.00 | $733.18 | |||
| June | $475.00 | $676.00 | $994.62 | |||
| July | $200.00 | $380.00 | $1,075.13 | |||
| August | $375.00 | $501.00 | $775.78 | |||
| September | $499.00 | $716.88 | $1,093.00 | |||
| October | $236.00 | $479.38 | $1,124.71 | |||
| November | $418.00 | $514.57 | $808.15 | |||
| December | $624.00 | $760.03 | $1,177.14 | |||
| YTD Total | $4,169.00 | $6,192.86 | $10,760.51 | $1,104.37 | $465.25 | 73.76% |
My average increase so far this year is $465.25 per month. ($465.25/1)
One of my goals for this year is to increase my dividend payout an average of $200 per month over the previous year. It was set at $170 per month but I almost doubled that goal last year so I upped it a little bit.
How Much Free Money?
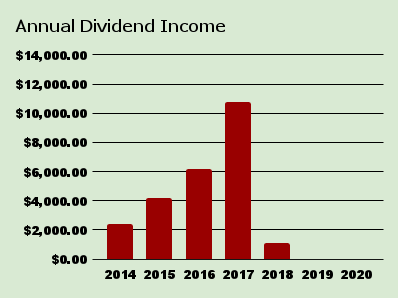
I’ve earned $1,104 in dividends so far this year.
| Year | Total Dividends Received |
| 2014 | $2,421 |
| 2015 | $4,169 |
| 2016 | $6,193 |
| 2017 | $10,760 |
| 2018 | $1,104 |
| 2019 | $0.00 |
| 2020 | $0.00 |
| Total | $24,647 |
My total dividend goal this year is $12,000. I increased this goal from $10,000 to $12,000 to keep in line with my growth.
Since 2014 I have received $24,647 worth of dividends. This does not include any capital appreciation.
Moves
I bought more Enbridge, CIBC, First National, Archer Daniels, Canadian Util, Highliner, ZLB Low Vol, Enbridge Income.
I sold Western Digital and Blackberry.
Until next time.
Stay classy Fire bros