Being rich is a very relative term. My definition of being rich is when you are able to reach true financial independence – the ability to live comfortably off one’s savings and investments with no debt whatsoever.
When I was young I figured the path to financial freedom would be a cakewalk, a real stroll down happy sunshine street. Well life some times kick you in the face. I remember back in 2006, thinking to myself, where did all this debt come from? How am I going to ever fix this mess? Well the answer is, it takes a plan.
The good news is that many individuals — particularly those with a little self-discipline and some good advice — can reach this goal. Here are my 3 simple steps to becoming rich.
STEP #1) Create A Budget

Creating a budget sounds like a bore and a chore and the truth is it kind of is. Nobody likes to see all of their bad habits listed out on a sheet of paper but if you can’t be honest with yourself you will not be able to fix the problems that the there.
There are many cool apps in today’s digital world that have made creating a budget easy, one I personally use is MINT but there are many to choose from. When making a budget, the goal should be to make it as autonomous as possible. The less work you have to do on it the more useful it becomes.
Steps to creating a budget.
A) Calculate how much money you take home in a month after taxes.
I personally like to make monthly budgets because they are easy to include in a yearly budget and I don’t have to work at it too much.
B) Calculate your expenses.
I find the easiest way to do this is, use only one account that all your spending comes out of. I use a standard checking account and at the end of the month I print it out and manually go through it.
C) Divide your expenses into basic categories.
The way I like to do this is to start by making only 2 categories. My #1 category is: HARD CAP and my #2 category is: SOFT CAP.
My HARD CAP category is made up of the bills and payments that are locked in and I don’t have much room to change them.
Examples of what I keep in the category would be: Mortgage payments, Utilities, Property Taxes, Car payments and Insurance. I’m always looking at ways to lower my Hard Caps but the majority of my focus will fall to the Soft Caps bracket.
In the SOFT CAP Bracket will be my discretionary spending.
This will have sub categories in it such as Food, Car Maintenance, Entertainment, Clothing, Restaurants, Alcohol (I like to make beer and wine), Vacations and Miscellaneous. These are the things that I spend money on and really try to get down.
D) Calculate your totals. Add up your income and then subtract your expenses.
Now when you do this for the very first time you might be in for a bit of a shock. I remember my first budget and I was blown away at some of my spending choices. 100 tacos for $100 seemed like a good idea at the time. I quickly realized that I was spending more than I was earning on things I really didn’t need all that much. As Tyler Durden once said “The things you own, end up owning you”.
This is a quick I budget sheet I just built in google sheets just to give you a rough example what mine might look like.
| INCOME |
|
HARD CAP EXPENSES |
|
SOFT CAP EXPENSES |
|
| Paycheck |
$2,250 |
Mortgage |
$900 |
Food |
$600 |
| Bonus |
$100 |
Utilities |
$125 |
Alcohol |
$40 |
| Interest |
$100 |
Property Tax |
$100 |
Entertainment |
$125 |
| Other |
$50 |
Car Payments |
$200 |
Clothing |
$200 |
| Custom category |
$0 |
Insurance |
$50 |
Restaurants |
$125 |
|
|
Custom category 1 |
$0 |
Presents |
$50 |
|
|
Custom category 2 |
$0 |
Charity |
$150 |
|
|
|
|
|
|
| TOTAL INCOME |
$2,500 |
TOTAL HARD CAP EXPENSES |
$1,375 |
TOTAL SOFT CAP EXPENSES |
$1,290 |
| |
|
|
|
|
|
|
|
|
|
|
|
| TOTAL INCOME |
$2,500 |
|
|
|
|
| TOTAL EXPENSES |
$2,665 |
|
|
|
|
|
|
|
|
|
|
| TOTAL SAVINGS |
-$165 |
|
|
|
|
|
|
|
|
|
|
Using a spread sheet makes it very apparent. I’m spending more than I earn. Now that I have an idea of how much is coming in and how much is going out it’s time to decide if i’m happy with my spending or if I want to move forward, cut Soft cap spending and move on to step #2: start to get rich.
STEP #2) Pay Yourself First

“It’s not how much money you make, but how much money you keep” – Robert Kiyosaki
Paying yourself first might sound a little bit cliché these days but it is for a very good reason. If there was a golden rule in personal finance, this would be it. Paying yourself first is where you set aside a certain, predetermined amount of money as soon as you receive it. This removes any temptation to spend that money on Soft cap expenses.
Steps to Paying yourself first.
A) Decided how much money you can reasonably afford to set aside every payday.
It’s better to start small here and increase this number as you become more frugal or earn more income. The way I did this was, whenever I received a pay raise, I would increase my savings to match that amount. Today I make over double what I did when I started and still follow this rule.
B) Open a separate account at the bank.
Preferably one that makes it difficult to withdraw from.
C)Make the payments automatic.
I consider the payment the same as I would a bill. I know it is coming.
Paying yourself first is an absolute must step to becoming financially secure.
STEP #3) Change Your Spending Habits.

Spending money is like a drug and it feels good. Most people would agree that buying stuff feels good, at least for a little while. Now what I’m going to say next might shock you, but, I don’t think spending is bad. In fact I would argue that spending money is great and it’s one of my favorite things to do. Now hear me out. It’s not the act of spending money that makes you poor or but what you are spending the money on.
Here is an example.
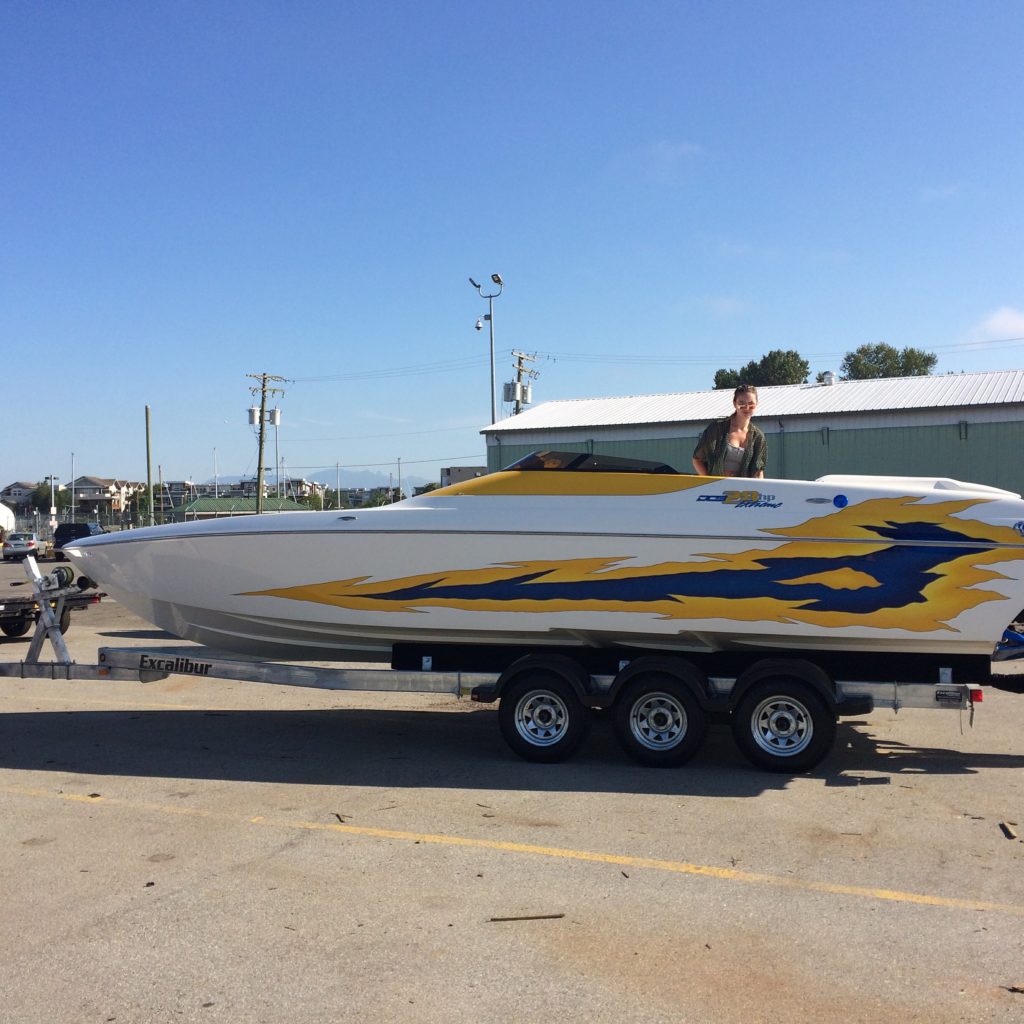
My friend called me up the other day and asked if I wanted to go out on his new boat. He said to me “you bring the beer, I’ll pay for the gas”. After steady negotiations I talked him down from 24 beers to 12, a moral victory for me, (plus I had to go to work in the morning).He agreed and out to the chuck we went.
After cruising around the Islands for a few hours he decides to “top up the tank”. Well to my shock, it cost him very close to $300! That was over a hundred dollars an hour. The dozen beers I bought didn’t seem like such a hefty price after that.
Later that evening I started thinking to myself about how nice that boat was and how I wished I could have one when it dawned on me. I could have one. I’ve worked hard. I have enough in my savings.
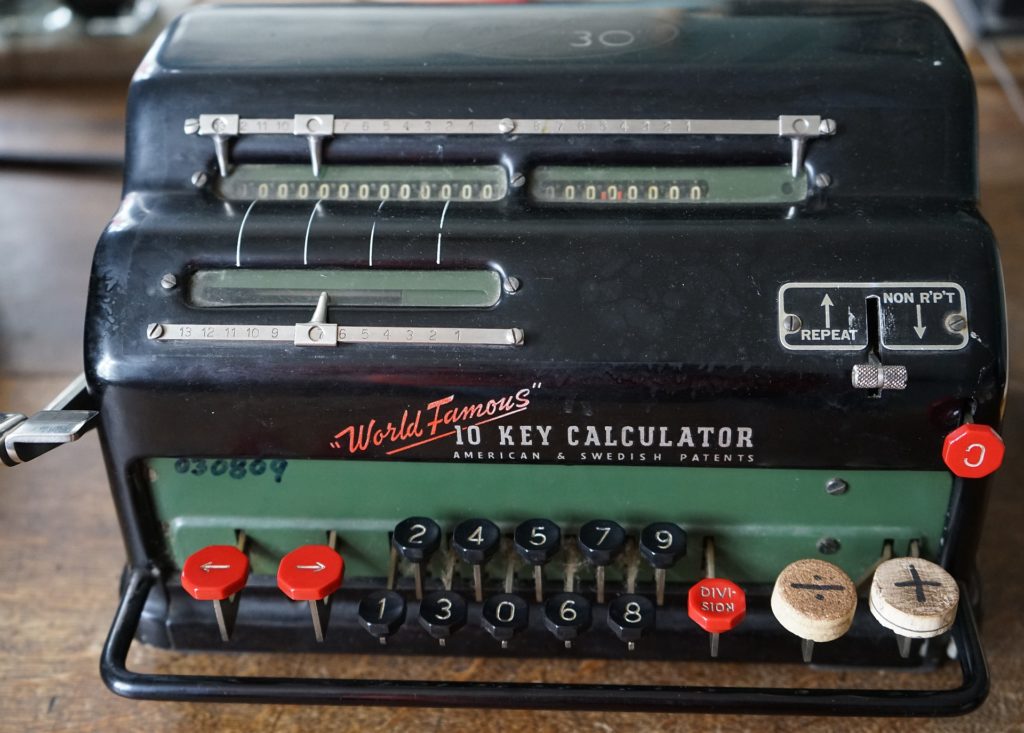
So being the type of guy I am I grabbed my calculator to do some number crunching.
The price of the boat was roughly $100,000.
Add $15,000 Tax.
Add 10% per year maintenance and gas (low ball) $11,000 per year.
Now if I keep the boat for 10 years, my total cost would be $225,000 . I did a quick look on line and found very similar boats that were 10 years old were selling for around $30,000-$50,000. So if I sold the boat at the upper limit of $50,000-my net loss would be $175,000. That’s a lot of $1 tacos.
Lets flip things
I thought to myself, what if I reverse this calculation and pretend that I was to buy a mediocre stock with a 6% return on investment per year. I took my initial price of $115,000 then I added my $900 per month I would have spent on maintenance. Then I added it up over 10 years. This is what a came up with.
| Year |
Year Deposits |
Year Interest |
Total Deposits |
Total Interest |
Balance |
|
|
|
|
|
|
| 1 |
$10,800.00 |
$7,469.00 |
$125,800.00 |
$7,469.00 |
$133,269.00 |
| 2 |
$10,800.00 |
$8,598.59 |
$136,600.00 |
$16,067.59 |
$152,667.59 |
| 3 |
$10,800.00 |
$9,798.04 |
$147,400.00 |
$25,865.63 |
$173,265.63 |
| 4 |
$10,800.00 |
$11,071.64 |
$158,200.00 |
$36,937.27 |
$195,137.27 |
| 5 |
$10,800.00 |
$12,423.99 |
$169,000.00 |
$49,361.26 |
$218,361.26 |
| 6 |
$10,800.00 |
$13,859.96 |
$179,800.00 |
$63,221.22 |
$243,021.22 |
| 7 |
$10,800.00 |
$15,384.72 |
$190,600.00 |
$78,605.94 |
$269,205.94 |
| 8 |
$10,800.00 |
$17,003.75 |
$201,400.00 |
$95,609.69 |
$297,009.69 |
| 9 |
$10,800.00 |
$18,722.90 |
$212,200.00 |
$114,332.59 |
$326,532.59 |
| 10 |
$10,800.00 |
$20,548.34 |
$223,000.00 |
$134,880.92 |
$357,880.92 |
At the end of the 10 years I would have $357,880 without the boat. I would have more money in interest ($134,880.92) than the original purchase price of the boat. I’m not buying a boat.
My point is this. I like to spend money as much as the next person, I just like to spend money on things that will make me money back. The more you enjoy spending your money on the things that will make you money the sooner you will become rich.